How to Read an Earnings Report: A Beginner's Guide
Earnings season can feel like alphabet soup. Learn what 10-Qs, 10-Ks and 8-Ks are, how to read revenue, EPS and cash flow, and why non-GAAP numbers need a second look.
When a public company reports earnings, it tells investors how much it sold, how much it kept as profit and how much cash it produced over the last quarter or year. Learning to read those numbers helps you look past the headline and judge whether a business is actually getting stronger.
Where earnings reports come from
U.S. public companies report results in a few places:
- Earnings press release and Form 8-K: many companies announce quarterly and annual results in a press release and an 8-K at the same time. This is usually what moves the stock on earnings day.
- Form 10-Q: the quarterly report, filed after each of the first three fiscal quarters. Its financial statements are unaudited.
- Form 10-K: the annual report, with financial statements audited by an independent accountant.
All 10-Ks and 10-Qs are free on the SEC’s EDGAR website, and most companies also post them in the investor relations section of their own site.
Large companies must file a 10-Q within 40 days after the quarter ends and a 10-K within 60 days after the year ends; smaller companies get more time. In May 2026 the SEC proposed letting companies report semiannually instead of quarterly. As of this writing that is still a proposal, so quarterly 10-Qs remain the rule.
The five numbers to check first
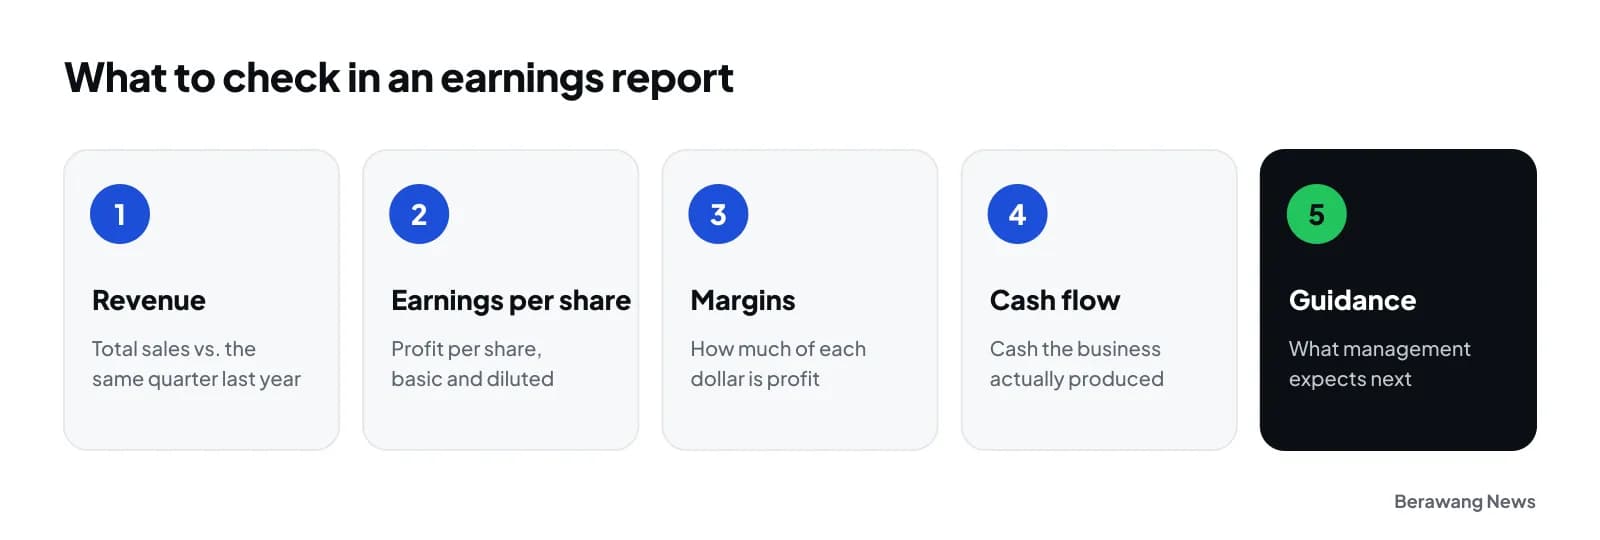
- Revenue: the dollar value of all the products and services the company sold. Compare it with the same quarter a year earlier to see real growth, since many businesses are seasonal.
- Earnings per share (EPS): net profit divided by the number of common shares. Reports show basic EPS and diluted EPS; diluted EPS also counts shares that could be created from stock options and similar securities, so it is usually the more conservative figure.
- Margins: how much of each dollar of revenue becomes profit. Rising revenue with shrinking margins can be a warning sign.
- Cash flow: profit is an accounting figure; the cash flow statement shows how much cash the business actually brought in and spent.
- Outlook: many companies share what they expect for the next quarter or year. Markets often react as much to this outlook as to the past results.
How the income statement fits together
The income statement starts with revenue at the top, subtracts costs and expenses, and ends with net income (or loss) at the bottom, which is why profit is called the “bottom line.” Divide net income by the share count and you get EPS.
EPS also feeds the price-to-earnings ratio you see on a stock quote.
Be careful with non-GAAP numbers
Companies often highlight “adjusted” or non-GAAP figures that leave out certain costs. The rules require them to show the closest standard (GAAP) figure and explain the difference. As Investor.gov puts it, “it is up to you to decide how much weight to give to non-GAAP measures.” A good habit is to read the GAAP number first, then check what was removed to get the adjusted one.
A simple earnings-day routine
- Read the press release headline numbers: revenue, EPS and the outlook.
- Compare them with the same period last year.
- Check the GAAP figures behind any adjusted numbers.
- Look at cash flow and debt in the balance sheet.
- Read management’s discussion (MD&A) in the 10-Q or 10-K for the reasons behind the numbers.
If you are just starting out, read how to start investing in stocks next.
Frequently asked questions
What is the difference between a 10-Q and a 10-K?
A 10-Q is the quarterly report with unaudited financial statements. A 10-K is the annual report with audited financial statements and more detail about the business and its risks.
What is a good EPS?
There is no single good number. Compare a company’s EPS with its own past results and with companies in the same industry, and watch whether it is growing over time.
Why did a stock fall after strong earnings?
Prices reflect expectations. A stock can fall if results or the company’s outlook were weaker than investors expected, even when profits rose.
Where can I find a company’s earnings report?
On the SEC’s EDGAR website or the investor relations page of the company’s website.
This guide is for education only and is not investment advice.