Daftar Isi
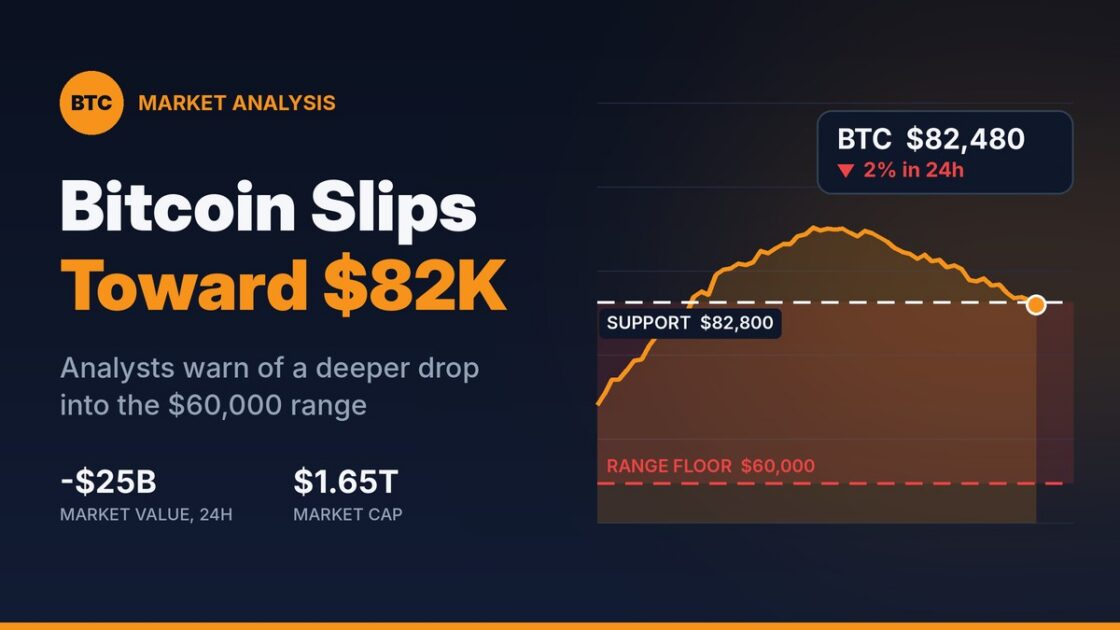
Bitcoin shed more than $25 billion in market value over 24 hours on Monday, October 12, 2026, leaving its total market capitalization near $1.65 trillion. The decline arrived alongside fresh warnings from market analysts, cited by Finbold, that the cryptocurrency’s latest breakout may lack the momentum to hold.
At the time of that report, BTC traded around $82,480, down nearly 2% on the day and sitting just below a level one analyst calls critical support near $82,800. Trading activity surged at the same time, with 24-hour volume jumping more than 99% to $22.8 billion, according to CoinMarketCap data.
The pressure is not purely technical. Long-dated U.S. Treasury yields have climbed to their highest levels in over two decades, and analysts warn that if bond-market stress pushes the Federal Reserve toward tighter policy, further selling could follow.
Why Analysts See Room for Further Downside
The $82,800 Line
Aksel Kibar, a former fund manager at the National Bank of Abu Dhabi, cautioned on Monday that the recent breakout is running short on fuel. In his view, the price could slide back into a liquidity range stretching from roughly $82,800 down to $60,000.
To avoid that outcome, Kibar argued, BTC needs to rebound and rally convincingly above the $82,800 area. With the price trading only a few hundred dollars under that mark at the time of the report, the level is effectively the line separating a recovery from a deeper retreat.
What a Liquidity Range Means
Traders use the term to describe a price zone where large volumes of buying and selling have previously taken place. When upward momentum fades, markets often drift back into these zones as orders cluster there. The range Kibar identified is wide: a move to its $60,000 floor would mean a decline of about 27% from the $82,480 price cited in the report.
Bond Yields Add Macro Pressure
Daniela Hathorn, senior market analyst at Capital.com, told Finbold on Monday that BTC’s recent choppiness has coincided with yields on U.S. government bonds, including 10-year and 30-year Treasuries, rising to their highest levels since 2002.
That matters because higher yields raise the return investors can earn on relatively safe assets. When government debt pays more, the opportunity cost of holding assets that generate no income, such as Bitcoin, goes up, and speculative markets tend to feel the strain.
The Federal Reserve Scenario
The analysts’ broader warning hinges on policy. If rising yields feed into inflation concerns strong enough to prompt monetary tightening from the Fed, they expect selling pressure on BTC to intensify. That outcome remains a conditional risk flagged by analysts, not a confirmed policy direction.
Key Figures at a Glance
| Metric | Figure (as of Oct. 12 report) | Source |
|---|---|---|
| BTC price | About $82,480 | Finbold |
| 24-hour change | Down nearly 2% | Finbold |
| Market capitalization | About $1.65 trillion | Finbold |
| Market value lost in 24 hours | More than $25 billion | Finbold |
| 30-day change | Up 6.59% | Finbold |
| 24-hour trading volume | $22.8 billion, up more than 99% | CoinMarketCap |
| Support level cited | Near $82,800 | Aksel Kibar |
| Lower end of liquidity range | $60,000 | Aksel Kibar |
Mixed Signals: A Monthly Gain Against a Daily Slide
The short-term weakness sits inside a stronger monthly picture. Bitcoin is still up 6.59% over the past 30 days, a performance the report characterized as pointing to a renewed uptrend despite recent consolidation.
The volume spike is harder to read. A sharp rise in trading during a price decline can reflect active selling, but it can also signal buyers stepping in or traders repositioning. Volume alone does not reveal which side is in control.
What to Watch Next
Three markers will likely shape the near-term path:
- The $82,800 level: a sustained move back above it would undercut the bearish case Kibar outlined.
- Treasury yields: further gains in 10-year and 30-year yields would keep pressure on risk assets.
- Fed signals: any shift toward tightening would raise the odds of the deeper sell-off analysts described.
All figures here reflect the October 12 report and may have changed since publication, as crypto prices move around the clock.
Disclaimer: This content was partially produced with the help of AI tools and This content is for informational purposes only and not investment advice.