Daftar Isi
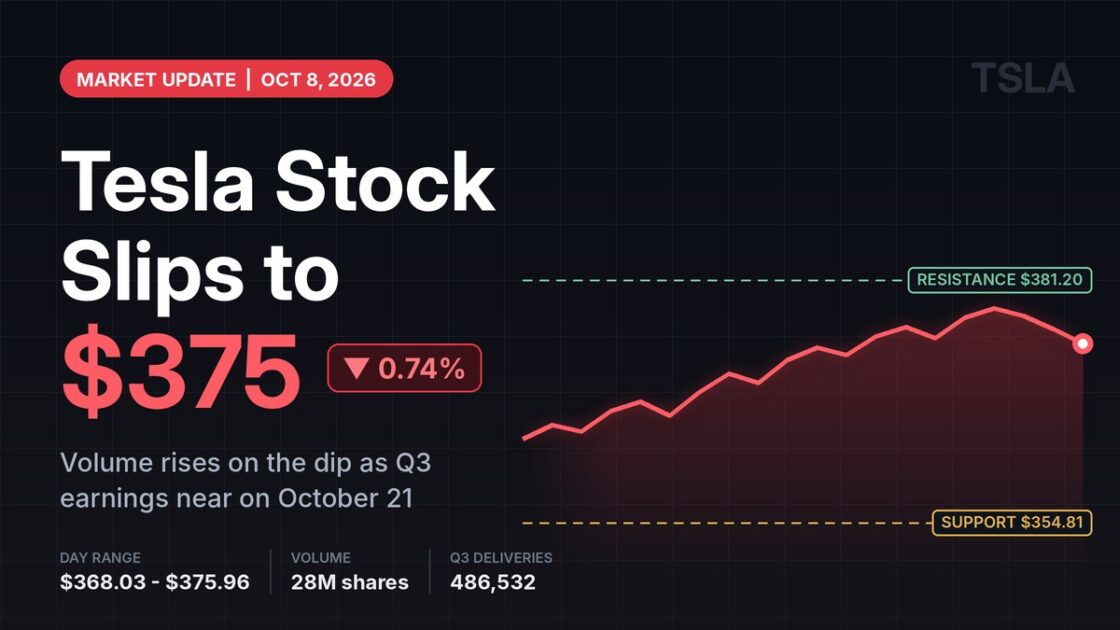
Tesla stock closed Thursday, October 8, 2026, at $375.00, down 0.744% from the prior close of $377.81. The drop itself was small. What caught technical analysts’ attention was that it came on heavier trading, a combination often read as a caution signal rather than routine noise.
Shares swung $7.93 during the session, sinking to a low of $368.03 before recovering to a high of $375.96. About 28 million shares changed hands, worth roughly $10.56 billion. That was 3 million more shares than the previous day, even as the price moved lower.
The pullback leaves the stock essentially flat over the past two weeks. Tesla has declined in 6 of its last 10 sessions and is down 0.78% over that stretch. Two company events are now in view: a rescheduled Roadster reveal and third-quarter financial results due later this month.
Delivery Beat Sets the Backdrop
The most recent hard data on the business came on October 2. According to Tesla’s filing with the SEC, the company produced 464,391 vehicles, delivered 486,532, and deployed 13.7 GWh of energy storage in the third quarter. That delivery figure topped the company-compiled analyst consensus of 461,974 by 24,558 vehicles, or roughly 5.3%.
The year-over-year picture is softer. Deliveries fell 2.1% from the record 497,099 in the third quarter of 2025, a period inflated by US buyers rushing to claim the $7,500 federal tax credit before it expired on September 30, 2025. Energy was the weak spot: storage deployments of 13.7 GWh came in below the 15.9 GWh analysts expected.
| Metric | Q3 2026 | Comparison |
|---|---|---|
| Vehicle deliveries | 486,532 | 461,974 consensus; 480,126 in Q2 2026; 497,099 in Q3 2025 |
| Vehicle production | 464,391 | 451,758 in Q2 2026 |
| Energy storage deployed | 13.7 GWh | 15.9 GWh consensus |
What the Chart Is Signaling
The technical read in the original report is genuinely split, and it is worth separating the bearish and bullish indicators rather than blending them into a single verdict.
Signals Pointing Lower
A sell signal was triggered from a pivot top on Tuesday, October 6, and shares have dropped 1.49% since. The report says further weakness is indicated until a new bottom pivot forms. The three-month Moving Average Convergence Divergence (MACD) indicator is also flashing a sell signal, and volume rising on a down day reinforces the case for watching the stock closely over the next few sessions.
Signals Pointing Higher
Both short-term and long-term moving averages currently carry buy signals, and the short-term average sits above the long-term one, which the report treats as a general buy signal. The stock is trading in the upper part of a wide but weak rising trend. According to the report, that position can invite a pullback toward the lower end of the trend, while a break above the upper trend line would point to a faster climb.
Key Price Levels
| Level | Price | What it means |
|---|---|---|
| Upper trend line | $381.20 | A break above would signal a stronger uptrend |
| First support | $370.25 | Moving-average support on dips |
| Second support | $363.53 | A break below would issue a sell signal |
| Volume support | $354.81 and $354.08 | Accumulated trading volume |
| Deeper support | $319.69 | Next volume-based floor if the above fail |
Volatility and Risk
Thursday’s 2.15% intraday range was close to normal for the name. Over the past week, Tesla stock has averaged daily volatility of 2.87%, and with healthy trading volume, the report rates its risk as medium.
Analyst Stance and Near-Term Outlook
On October 8, Tigress Financial maintained its Buy rating on TSLA, according to the original report. The report’s own statistical model projects a 4.56% gain over the next three months, with a 90% probability range of $325.47 to $398.56 at the end of that period. These are model-based projections built on the current short-term trend, not guidance from Tesla or a consensus price target.
The report stops short of calling Tesla stock a buy. It concludes that positive signals are present but not strong enough, and labels the shares a hold candidate while the picture develops.
Some longer perspective helps here. Tesla’s 52-week high stands at $498.83, which puts Thursday’s close roughly 25% below that peak.
Upcoming Catalysts
Tesla pushed its new Roadster reveal, originally planned for October 1, to October 15, citing weather concerns. The bigger test follows a week later. The company will release third-quarter financial results after the market closes on Wednesday, October 21, 2026, and hold a live Q&A webcast at 4:30 p.m. Central Time. Margins and commentary on demand after the tax credit’s expiration are likely to matter more to the stock than this week’s chart patterns.
Disclaimer: This content was partially produced with the help of AI tools and This content is for informational purposes only and not investment advice.