Daftar Isi
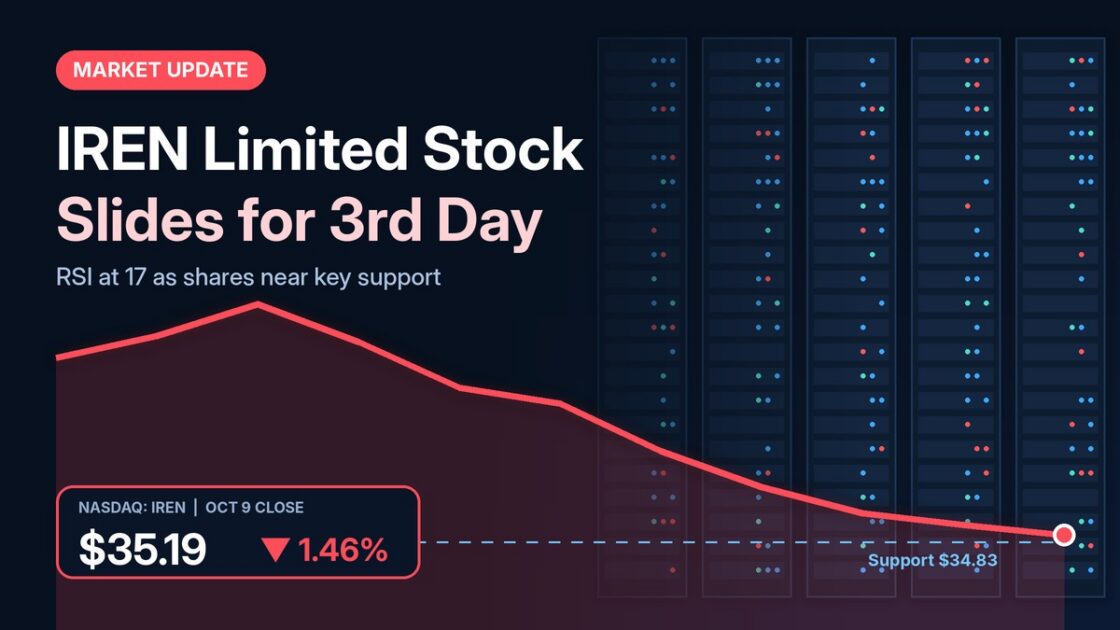
IREN Limited stock closed Friday, October 9, 2026, at $35.19, down 1.46% from Thursday’s close of $35.71. It was the third losing session in a row for the Nasdaq-listed company, which has turned from bitcoin mining toward AI cloud computing and now falls hard whenever sentiment around AI infrastructure turns.
The losses have piled up quickly. The shares have declined in eight of the last ten trading days, a stretch that has erased 20.26% of their value. Friday’s session alone saw a 4.76% swing between an intraday low of $34.64 and a high of $36.29, with roughly 38 million shares, worth about $1.32 billion, changing hands.
The pullback follows a mid-September period when analyst upgrades briefly lifted the stock. With a key support level sitting just below Friday’s close and momentum indicators at extreme readings, the next few sessions should show whether the selling is running out of steam or about to accelerate.
Friday’s session by the numbers
| Metric | Value |
|---|---|
| Closing price (Oct. 9) | $35.19 |
| Previous close | $35.71 |
| Daily change | -1.46% |
| Intraday range | $34.64 to $36.29 |
| Volume | About 38 million shares |
| Dollar volume | About $1.32 billion |
| 10-day change | -20.26% |
| RSI (14-day) | 17 |
Trading volume dropped by roughly 17 million shares from the prior session. The technical report that accompanied the price data reads lighter volume on a down day as a modestly reassuring sign, since it suggests the selling was not driven by a surge of heavy exits.
Analysts remain split on the stock
Wall Street opinion on the company has been mixed throughout September. JPMorgan upgraded IREN to Overweight with a $65 price target, pointing to its Nvidia partnership, a growing book of AI cloud contracts and better pricing across the neocloud market. The source report also notes that BTIG reiterated its Buy rating on September 14.
Not every firm was as optimistic. Rothschild & Co Redburn analyst Alexander Haissl began covering IREN on September 21, 2026, with a Neutral rating and a $40 target, a level the stock now trades below. Even bullish coverage has flagged the risks: IREN is a high-beta stock with a premium valuation, which makes the shares sensitive to swings in AI-stock sentiment and to execution expectations.
What the technical indicators show
Signals pointing lower
The technical picture for IREN Limited stock is mostly negative right now. Both short-term and long-term moving averages are issuing sell signals. The long-term average sits above the short-term average, which is generally read as a bearish setup. The three-month MACD indicator is also flashing a sell signal.
According to the report, a pivot top formed on Tuesday, September 22, 2026, and the stock has fallen 27.52% since then. On any rebound, the report identifies resistance at $39.11 and $41.93, and a move above either level would trigger buy signals.
Support levels and the oversold reading
Accumulated trading volume provides support near $34.83, just below Friday’s close, and the report notes that a test of this level could produce a bounce. A deeper floor sits at $33.25, the lower edge of a broad short-term rising trend. A break below that line would first suggest a slower pace of gains, and could serve as an early warning of a trend reversal.
The 14-day RSI reading of 17 places the stock firmly in oversold territory. That can come before a rebound, but it is not a reliable timing signal. Some stocks keep falling for extended periods while oversold.
Volatility remains elevated
Over the past week, IREN has averaged a daily price swing of 5.63%, and wide Bollinger Band readings lead the report to classify the shares as high risk. That fits the stock’s broader profile: MarketBeat lists a beta of 4.28, meaning it has historically moved far more than the overall market.
Why the shares swing so sharply
Background: from bitcoin miner to AI cloud provider
IREN’s valuation now depends largely on its shift into AI computing. The company signed a five-year, $3.4 billion AI cloud contract with NVIDIA on top of an existing $9.7 billion agreement with Microsoft. Those deals underpin the long-term bull case, but they also tie the stock closely to investor appetite for AI infrastructure names. Analysts have also highlighted execution risks, including deeply negative free cash flow and concerns about refinancing convertible debt.
What to watch next
The source report sends two different signals. Based purely on the short-term rising trend, its model projects an 11.07% gain over the next three months. It gives a 90% probability that the price ends that period between $36.93 and $55.04. However, because so many indicators are currently negative, the same report expects weak performance over the coming days and weeks and gives the stock an overall negative evaluation.
In the near term, the $34.83 support level and the $33.25 trend floor are the key lines to watch on the downside. On the upside, a recovery above $39.11 would be the first sign that buyers are regaining control. All figures here are as of Friday’s close.
Disclaimer: This content was partially produced with the help of AI tools and This content is for informational purposes only and not investment advice.