Daftar Isi
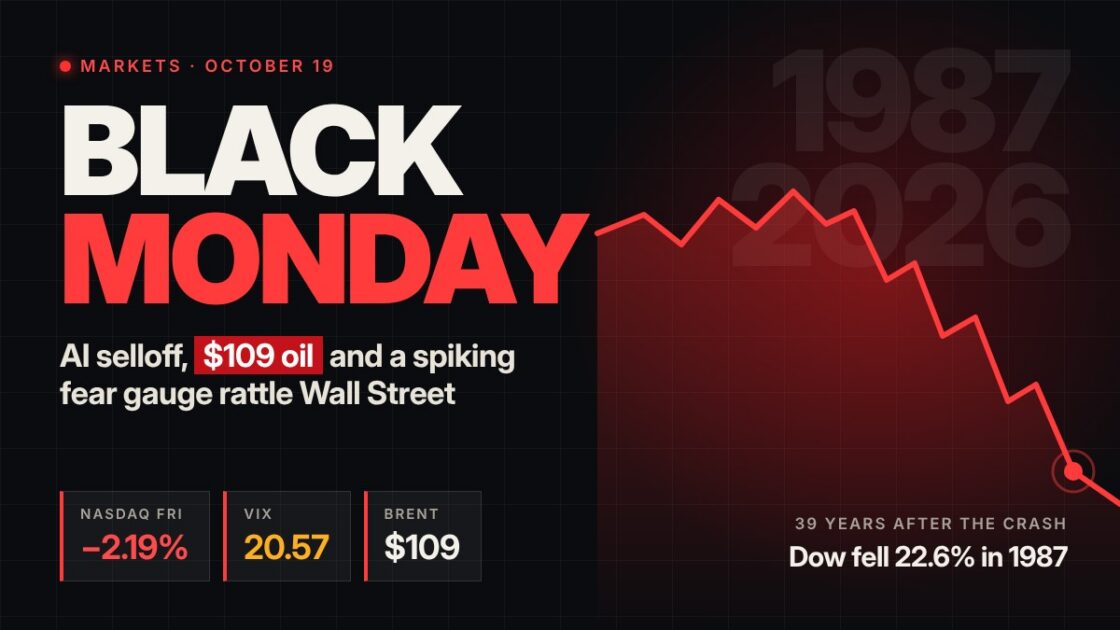
Investors head into Monday, October 19, carrying the weight of a bruising week. The date marks 39 years since the 1987 Black Monday crash, and it falls on a Monday again in 2026, arriving just as an AI-driven selloff, climbing oil prices and stubborn inflation data have pushed Wall Street’s fear gauge to its highest level since late July.
The damage on Friday was concentrated in technology. The Nasdaq Composite dropped 2.19%, closing out a week in which it lost more than 4%, while the S&P 500 posted its weakest weekly showing since January, according to Reuters.
Calendar coincidences do not move markets, and nothing about the date itself signals a repeat of 1987. The more useful question is whether the pressures behind last week’s slide are deepening, and what traders are actually betting on before the opening bell.
Where markets stood at Friday’s close
The figures below reflect trading through Friday, October 16. Weekend developments, particularly in oil and the Middle East, could change the picture before Monday’s open.
| Measure | Move | Note |
|---|---|---|
| Nasdaq Composite | down 2.19% | Off more than 4% for the week |
| S&P 500 | down 1.22% | Worst week since January |
| Dow Jones Industrial Average | down 0.55% | Smallest decline of the three |
| Cboe Volatility Index (VIX) | up nearly 25% to 20.57 | Highest since late July |
| CoreWeave (CRWV) | down 12% | About 25% lower over five sessions |
| Broadcom (AVGO) | down 3.6% | Chip index down eight straight sessions |
| Brent crude | about $109 a barrel | Middle East supply fears |
Three pressures driving the selloff
Doubts about AI spending and the debt behind it
The sharpest losses hit companies at the center of the AI infrastructure buildout. Investors are increasingly asking whether firms pouring money into data centers can earn enough to justify that spending.
CoreWeave became the focal point. Beyond the stock’s slide, its bonds sold off hard enough to push yields above 15%, a signal that lenders are demanding far more compensation to hold the company’s debt. That matters beyond one name. If heavily leveraged AI infrastructure providers struggle to service their borrowing, the strain could spill into credit markets and the wider economy.
Oil, inflation and the Fed
Brent’s climb to roughly $109 a barrel adds a second layer of risk. Higher energy costs feed directly into inflation, which in turn narrows the Federal Reserve’s room to cut interest rates. U.S. producer-price data came in hotter than expected last week, reinforcing the view that borrowing costs may stay elevated. Growth stocks, whose valuations depend heavily on future earnings, tend to suffer most in that environment.
Leverage in investor accounts
U.S. margin debt reached about $1.5 trillion before easing to $1.4 trillion in August, still 27% above its level a year earlier. In a sustained decline, margin calls can force investors to sell holdings to cover loans, which can accelerate losses. High margin debt on its own, however, has never been a reliable timing signal for a crash.
What prediction markets are pricing
The AI bubble contract
Traders on Polymarket appear far calmer than the headlines. The platform put the odds of an AI bubble burst by December 31, 2026, at 7%, rising to 16% by June 30, 2027. The near-term contract has drawn about $2.44 million in volume; the longer-dated one has seen only about $26,906.
The contract resolves only if at least three defined events occur within 90 days, such as Nvidia falling 50% from its all-time high, the iShares Semiconductor ETF dropping 40% from its peak, or certain major AI company failures. Those odds measure the chance of meeting that narrow checklist, not the probability of a broad market crash.
Monday’s opening direction
A separate Polymarket contract on the S&P 500’s October 19 open showed a 44% chance of a higher start, implying 56% odds of a lower one. That is a modest lean, and it says nothing about how large any decline might be. The odds can also shift as trading continues through the weekend.
Why the 1987 comparison only goes so far
On October 19, 1987, the Dow plunged 22.6% in a single session, still its largest one-day percentage drop on record. Friday’s 0.55% Dow decline is nowhere near that territory, and the Black Monday parallel rests more on the calendar than on market conditions.
What changed after 1987
The 1987 crash led regulators to introduce trading curbs designed to slow panic selling. Today, market-wide circuit breakers pause trading for 15 minutes if the S&P 500 falls 7% or 13% from the prior close before 3:25 p.m. Eastern time, and halt trading for the rest of the day at a 20% drop. Those safeguards did not exist when the original Black Monday unfolded.
What to watch on Monday
The signals worth tracking are the ones that drove last week’s slide: Brent’s direction after the weekend, whether CoreWeave’s bonds stabilize, and whether the semiconductor index snaps its eight-session losing streak. A VIX holding above 20 would suggest anxiety is persisting rather than fading.