Daftar Isi
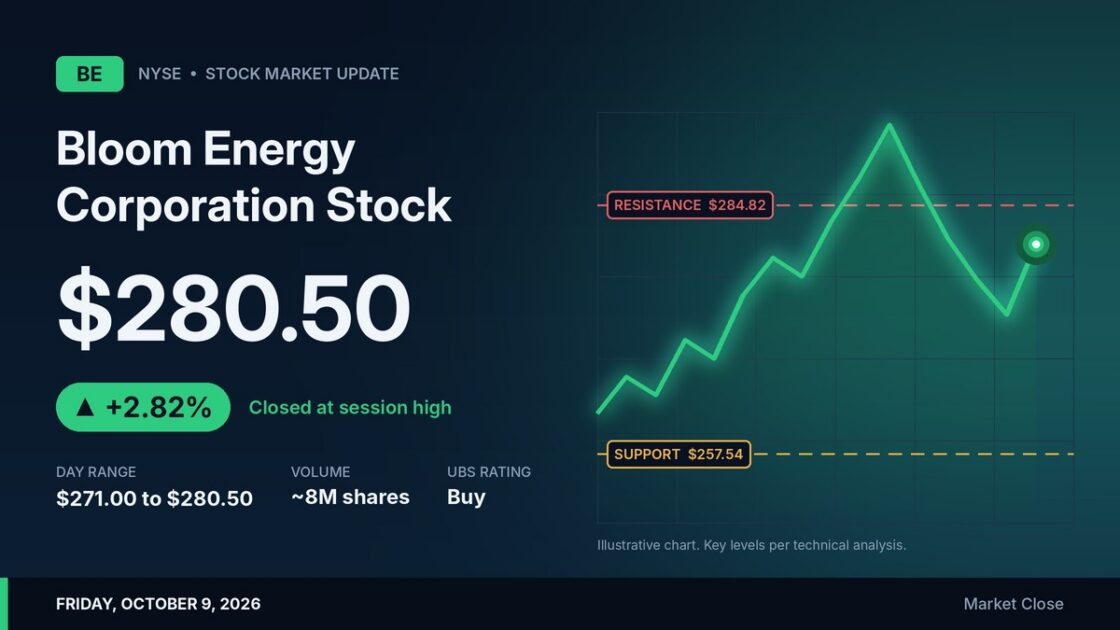
Bloom Energy Corporation stock closed Friday, October 9, 2026, at $280.50, up 2.82% from the prior close of $272.82. It finished at the day’s high, a firm close for a stock that has struggled to hold gains this month. The move came two days after UBS reaffirmed its Buy rating on the fuel cell company.
The day’s range was $271.00 to $280.50, a spread of $9.50, or 3.51%. About 8 million shares traded, worth roughly $2.36 billion, according to the session data behind this report. That was about 7 million fewer shares than the session before, which matters for how much weight the rally deserves.
Friday’s gain hasn’t erased the recent slide. The shares are still down 2.84% over the past two weeks. Next week will show whether buyers can push through a resistance level sitting just a few dollars above Friday’s close.
A Rally Without the Crowd
When a stock climbs on falling volume, technical analysts call it a divergence. Fewer shares changing hands on an up day can mean fewer buyers committed to the move, and that gap is often read as an early warning that the trend could shift within days. It isn’t a sell signal on its own. It does suggest Friday’s close should be treated cautiously until volume confirms it.
UBS Keeps Its Buy Rating
On October 7, UBS maintained its Buy rating on the company, which trades on the New York Stock Exchange as BE. The action was recorded as a “hold,” which in analyst rating terms means the firm left its existing view unchanged rather than upgrading or downgrading. The report did not include a price target from UBS.
Technical Signals Are Mixed
Moving averages
The moving averages send two messages at once. The price sits below its short-term moving average, which counts as a sell signal. But the short-term average remains above the long-term average, which produces a general buy signal and an overall positive reading.
Those averages also mark the levels traders are watching:
| Level | Price | What it means |
|---|---|---|
| Short-term moving average | ~$284.82 | Resistance; a break above would trigger a buy signal |
| Friday close | $280.50 | Session high |
| Accumulated volume support | $277.22 | Possible buying zone if tested |
| Friday low | $271.00 | Intraday floor |
| Long-term moving average | ~$257.54 | Support; a break below would trigger a sell signal |
Bearish indicators to watch
Several warning signs remain. A pivot top formed on Tuesday, October 6, triggering a sell signal, and the stock has fallen 5.17% since that point. The analysis suggests further weakness is possible until a new bottom pivot forms. The three-month Moving Average Convergence Divergence (MACD) indicator also shows a sell signal.
Where buyers may step in
Heavy trading in past sessions has built support around $277.22, just below Friday’s close. Levels like this often draw buyers when tested, so a dip toward that price could produce a rebound rather than a deeper decline.
Volatility and Risk
The analysis rates Bloom Energy Corporation stock as medium risk, citing average intraday movement and solid trading volume. Over the past week, though, daily volatility averaged 5.01%, well above Friday’s 3.51% range. Holders should expect sharp single-day swings in either direction.
What the Longer View Suggests
The trend model’s three-month projection
The stock sits in the middle of a wide, strong short-term uptrend, and the report’s trend model signals further gains. Extending that trend, the model projects a 40.59% rise over the next three months, with a 90% probability of the price ending that period between $327.22 and $421.56.
That projection is a statistical extrapolation of recent price action, not guidance from the company or a forecast from analysts covering it. Trend models assume current conditions continue. Earnings results, sector news, or a broader market selloff can quickly invalidate them.
How the signals net out
Weighing the negative signals against the uptrend, the analysis stops short of calling Bloom Energy Corporation stock a sell. It labels the shares a hold or accumulate candidate, noting a meaningful chance of a turnaround while the stock awaits clearer direction.
Background on Bloom Energy
Bloom Energy, based in San Jose, California, makes solid oxide fuel cell systems that generate electricity on site, letting customers run partly or fully independent of the grid. Its customers include utilities, hospitals, manufacturers, and data center operators. Investor interest in the stock has been closely tied to rising power demand from data centers built for artificial intelligence, which helps explain why the shares can move sharply on both company news and wider tech sentiment.
Disclaimer: This content was partially produced with the help of AI tools and This content is for informational purposes only and not investment advice.