Daftar Isi
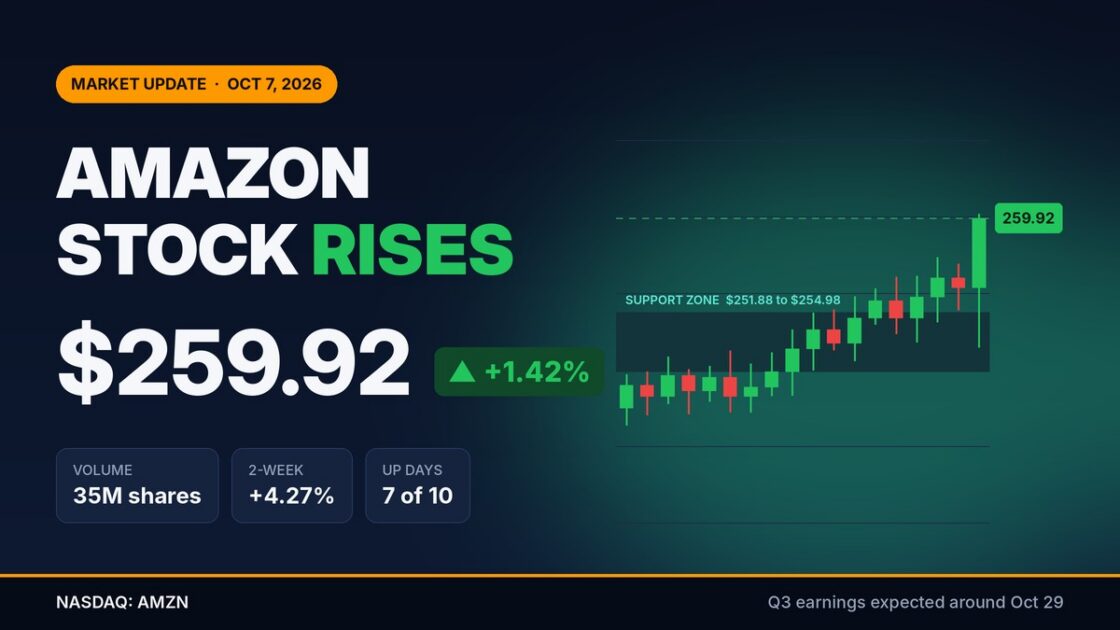
Amazon stock closed at $259.92 on Wednesday, October 7, 2026, up 1.42% from Tuesday’s $256.29 finish. The gain came on heavier trading. It also lands about three weeks before the company’s next quarterly report, a period when investors tend to reposition.
About 35 million shares changed hands during the session, roughly 2 million more than the day before, for a total value of about $8.99 billion. The stock traded between $253.17 and $260.14, a 2.75% intraday range, and closed near the high.
Wednesday extended a steady run. Shares have risen in 7 of the last 10 sessions and are up 4.27% over the past two weeks. Even so, Amazon remains below its spring peak, and the next major test is the third-quarter report expected at the end of the month.
Wednesday’s Session at a Glance
| Metric | Value |
|---|---|
| Previous close (Oct. 6) | $256.29 |
| Closing price (Oct. 7) | $259.92 |
| Daily change | +1.42% |
| Intraday low / high | $253.17 / $260.14 |
| Intraday range | $6.97 (2.75%) |
| Shares traded | ~35 million |
| Dollar volume | ~$8.99 billion |
| Two-week performance | +4.27% |
What the Technical Picture Shows
Most chart signals in the source report point upward, though not all of them. The main points follow.
Moving averages send mixed signals
Amazon stock is trading above both its short-term and long-term moving averages. Technical analysts generally read that as a buy signal. The longer-term average, however, still sits above the shorter-term one. That relationship counts as a general sell signal and suggests the recovery has not yet fully reversed the earlier downtrend.
The three-month Moving Average Convergence Divergence (MACD) indicator has also turned to a buy signal. Separately, a pivot-bottom buy signal triggered on September 16, 2026. The stock has gained 5.68% since then.
Support levels traders are watching
The report identifies the following price levels:
| Level | Price | Significance |
|---|---|---|
| Support (moving average) | $251.88 | Breakdown would trigger a sell signal |
| Support (moving average) | $254.85 | Breakdown would trigger a sell signal |
| Accumulated-volume support | $254.98 | Area where buyers have previously stepped in |
| Projected 3-month range | $250.00 to $290.34 | Range the stock may hold, per the model’s 90% probability estimate |
The stock is moving within a wide, sideways trend. According to the analysis, a breakout from that type of range usually comes with a sharp jump in volume. Stocks that turn upward from the middle of such a range are sometimes considered potential runners.
Volatility remains contained
Over the past week, Amazon stock has averaged daily volatility of 2.09%. The report describes the shares as moving in a controlled way with deep liquidity. Those conditions usually mean lower trading risk for a stock of Amazon’s size.
How to read these signals
Moving averages, MACD readings and support levels are backward-looking tools based on past price and volume. They describe momentum. They do not account for earnings, regulation or broader market moves, any of which can override a chart setup quickly.
Tigress Financial Keeps Its Buy Rating
On October 6, 2026, Tigress Financial reiterated its Buy rating on Amazon, keeping its existing stance unchanged. The firm has been bullish on the stock for years. In March, Tigress Financial analyst Ivan Feinseth raised his Amazon price target from $305 to $315 while maintaining a Buy rating. No updated target was given in the October 6 report.
Where Amazon Stock Stands in 2026
Wednesday’s close is still well below the year’s high. The shares hit a record of $278.56 on May 5, 2026, then pulled back to around $232 by late June. At $259.92, Amazon stock has recovered roughly 12% from that late-June level but sits about 7% below its peak.
Spending is a key part of the story. On its July 30 earnings call, management put 2026 capital spending at about $220 billion, much of it aimed at data centers and AI infrastructure. Investors are weighing whether that investment will pay off in faster cloud growth.
The earnings catalyst ahead
Amazon is expected to report third-quarter 2026 results on or around October 29, with Alphabet and Microsoft reporting around October 27. Those peer results will offer an early read on cloud demand. Growth at Amazon Web Services is expected to be the figure investors focus on most.
The stock has a history of sharp moves after earnings. Its worst decline over the past year was a 21.7% fall, from a November 3, 2025 closing high to a February 13, 2026 low. The support levels and three-month range above could shift quickly once the quarterly numbers are out.
Disclaimer: This content was partially produced with the help of AI tools and This content is for informational purposes only and not investment advice.